Example of graphs output
This scripts takes input vector data and randomly samples Size points over it. The result is returned as a vector layer. s
Script
##Basic statistics=group
##Graphs=name
##output_plots_to_html
##Layer=vector
##Field=Field Layer
qqnorm(Layer[[Field]])
qqline(Layer[[Field]])
Script lines description
- Basic statistics is the group of the algorithm.
- Graphs is the name of the algorithm.
- The script output plot or plots.
- Layer is the input vector layer.
- Field is the name of the field from Layer whose values will be plotted.
- Produce a standard QQ plot of the values from Field of Layer.
- Add a line to a “theoretical”, by default normal, quantile-quantile plot which passes through the probs quantiles, by default the first and third quartiles.
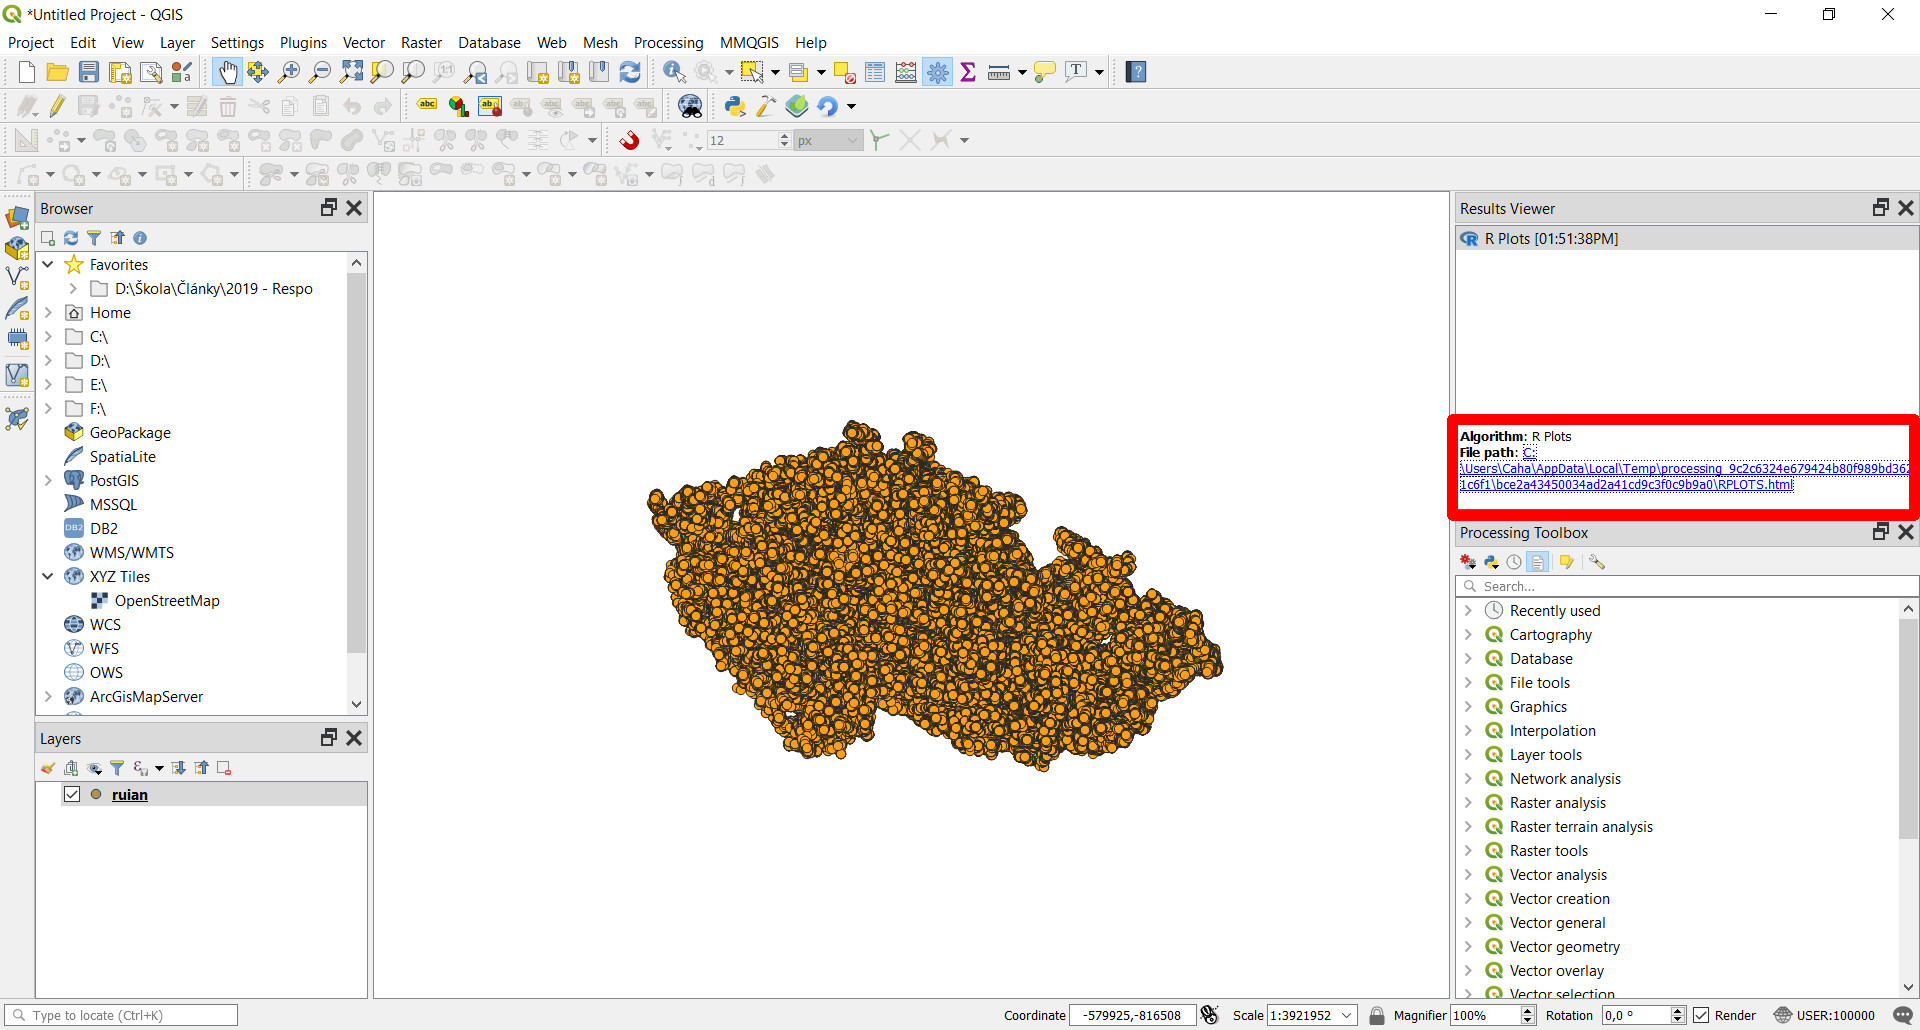
The plot is automatically added to the Result Viewer of Processing, and it can be open the location shown in the image.