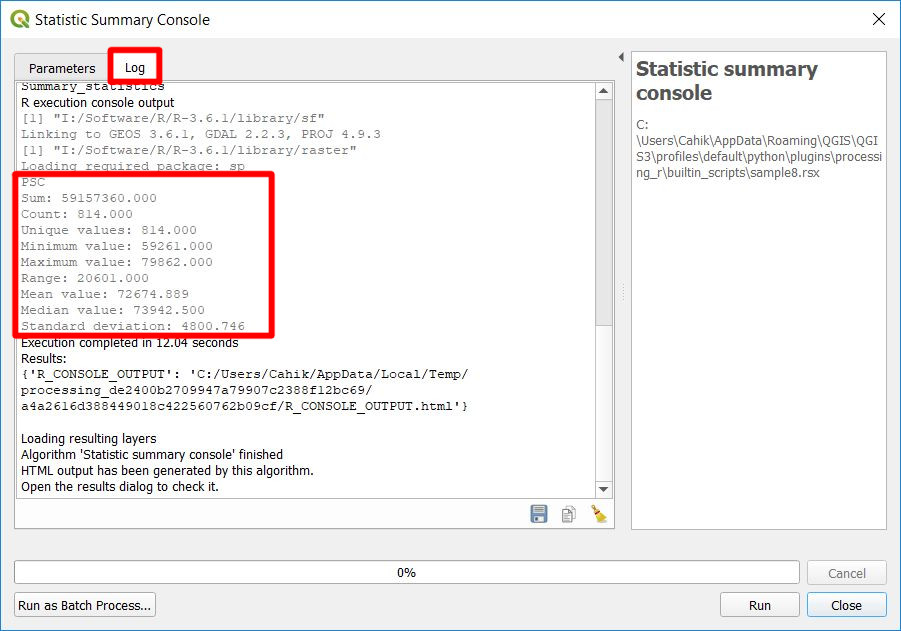
Example with tool console log
This script takes input vector data and one of its fields. The result is a tool console log with summary statistics for a given field of the layer.
Script
##Basic statistics=group
##Statistic summary console=name
##Layer=vector
##Field=Field Layer
Summary_statistics <- data.frame(rbind(
        sum(Layer[[Field]]),
        length(Layer[[Field]]),
        length(unique(Layer[[Field]])),
        min(Layer[[Field]]),
        max(Layer[[Field]]),
        max(Layer[[Field]])-min(Layer[[Field]]),
        mean(Layer[[Field]]),
        median(Layer[[Field]]),
        sd(Layer[[Field]])),
        row.names=c("Sum:","Count:","Unique values:","Minimum value:","Maximum value:","Range:","Mean value:","Median value:","Standard deviation:"))
colnames(Summary_statistics) <- c(Field)
>Summary_statistics
Script lines description
- Basic statistics is the group of the algorithm.
- Statistic summary console is the name of the algorithm.
- Layer is the input vector layer.
- Field is the name of a field from Layer.
- Create data.frame with calculated statistics and assign correct row names.
- Give the data.frame correct colname, the name of the field.
- Print the created data.frame to the tool console log.
The output will be shown in the tool console log.